Identifying Performance Bottlenecks in AWS Lambda and DynamoDB Interactions
Question
You're developing an AWS Lambda function that is interacting with a DynamoDB table.
The function was working well, but now it is giving the results with a time delay.
You need to debug the code to understand where the bottleneck is which is causing the performance issue.
Which of the following is the ideal way to debug the code?
Answers
Explanations
Click on the arrows to vote for the correct answer
A. B. C. D.Answer - D.
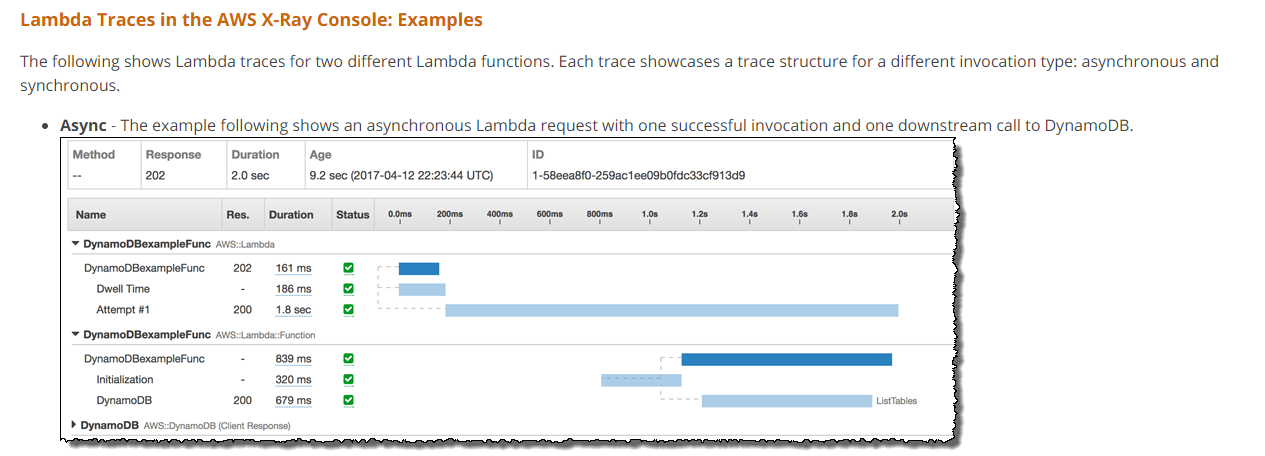
With AWS X-Ray, you can actually see traces in your AWS Lambda function, allowing you to see a detailed level of tracing to your downstream services.
The below snapshot from the AWS documentation shows an example of this.
Option A is incorrect since this is not an efficient way to check for performance errors.
Option B is incorrect since the logs might not be able to give you that level of tracing to detect the error.
Option C is incorrect since throttling errors will not give you the cause of the performance issue.
For more information on using AWS Lambda with X-Ray, please refer to the below Link-
https://docs.aws.amazon.com/lambda/latest/dg/lambda-x-ray.html
When a Lambda function interacting with DynamoDB table is giving results with time delay, it's important to identify the bottleneck in the code to improve its performance. There are several ways to debug the code, but among the options provided, the ideal way to debug the code is by using AWS X-Ray to see where the downstream delay could be (option D).
AWS X-Ray is a service that helps developers to analyze and debug distributed applications such as Lambda functions by providing end-to-end visibility into the application. It provides a graphical representation of the application's architecture and highlights the performance issues and errors. It can also identify the cause of the delay in the application's downstream dependencies.
Using Log statements (option A) in the code is a common way to debug the code, but it requires that you manually instrument the code and insert logging statements to identify the performance issue. This method can be time-consuming and may not always provide accurate information on the root cause of the issue.
Cloudwatch logs (option B) can be useful in debugging the code. However, it may not be the ideal way to identify performance issues. It provides a centralized repository for storing and analyzing logs, but it requires manual analysis of the logs to identify the cause of the delay.
Cloudwatch metrics (option C) provide a way to monitor the performance of the Lambda function and identify throttling errors. However, it may not provide enough information to identify the cause of the delay in the function's performance.
Therefore, using AWS X-Ray to see where the downstream delay could be (option D) is the ideal way to debug the code. AWS X-Ray provides a visual representation of the application's architecture, identifies performance issues and errors, and provides detailed information about the downstream dependencies. This information helps to identify the root cause of the delay and improve the performance of the Lambda function.
