Question 49 of 197 from exam AZ-100: Microsoft Azure Infrastructure and Deployment
Question
HOTSPOT -
You have an Azure subscription that contains several virtual machines and an Azure Log Analytics workspace named Workspace1.
You create a log search query as shown in the following exhibit.

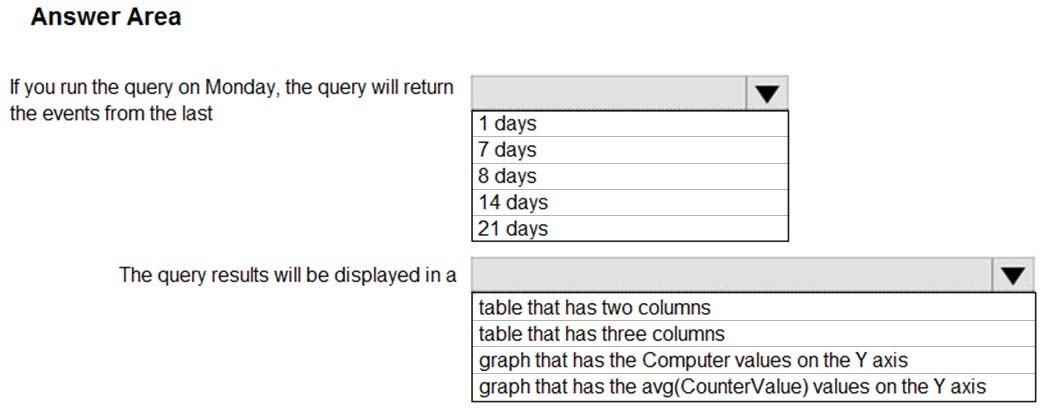
Use the drop-down menus to select the answer choice that completes each statement based on the information presented in the graphic.
NOTE: Each correct selection is worth one point.
Hot Area:

Explanations

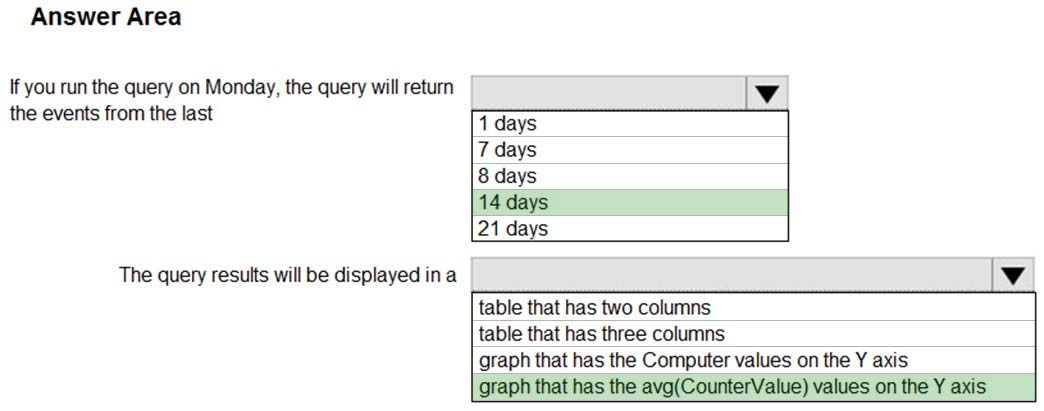
Box 1: 14 days -
Two weeks will be covered.
Note: Startofweek returns the start of the week containing the date, shifted by an offset, if provided.
Start of the week is considered to be a Sunday.
Endofweek returns the end of the week containing the date, shifted by an offset, if provided.
Last day of the week is considered to be a Saturday.
Box 2:
The render operator renders results in as graphical output. Timechart is a Line graph, where the first column is x-axis, and should be datetime. Other columns are y-axes. In this case the Y axis has avg(CounterValue) Values.
https://docs.microsoft.com/en-us/azure/azure-monitor/log-query/log-query-overview https://docs-analytics-eus.azurewebsites.net/queryLanguage/query_language_renderoperator.html