Question 156 of 156 from exam DP-900: Microsoft Azure Data Fundamentals
Question
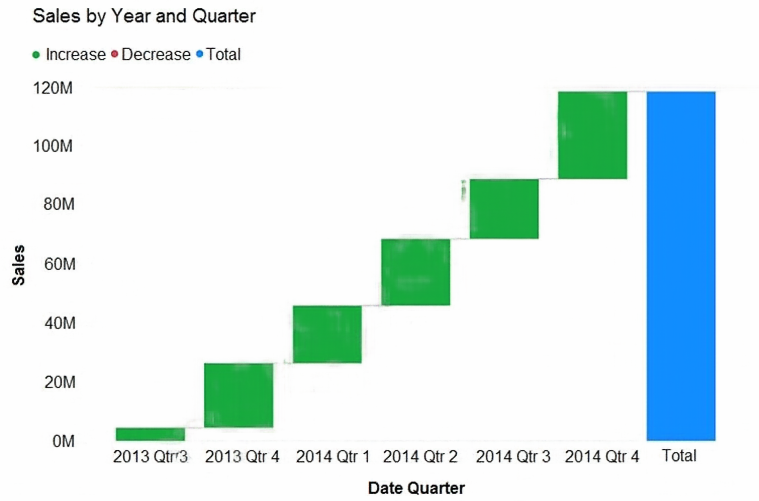
You need to create a visualization of running sales totals per quarter as shown in the following exhibit.

What should you create in Power BI Desktop?
Answers
Explanations
Click on the arrows to vote for the correct answer
A. B. C. D.A
https://docs.microsoft.com/en-us/power-bi/visuals/power-bi-visualization-types-for-reports-and-q-and-a