Track DynamoDB Read and Write Capacity Utilization
Question
Your company has just set up DynamoDB tables.
They need monitoring reports to be made available on how much Read and Write Capacity is being utilized.
This would help to get a good idea of how much the tables are being utilized.
How can you accomplish this?
Answers
Explanations
Click on the arrows to vote for the correct answer
A. B. C. D.Correct Answer: B.
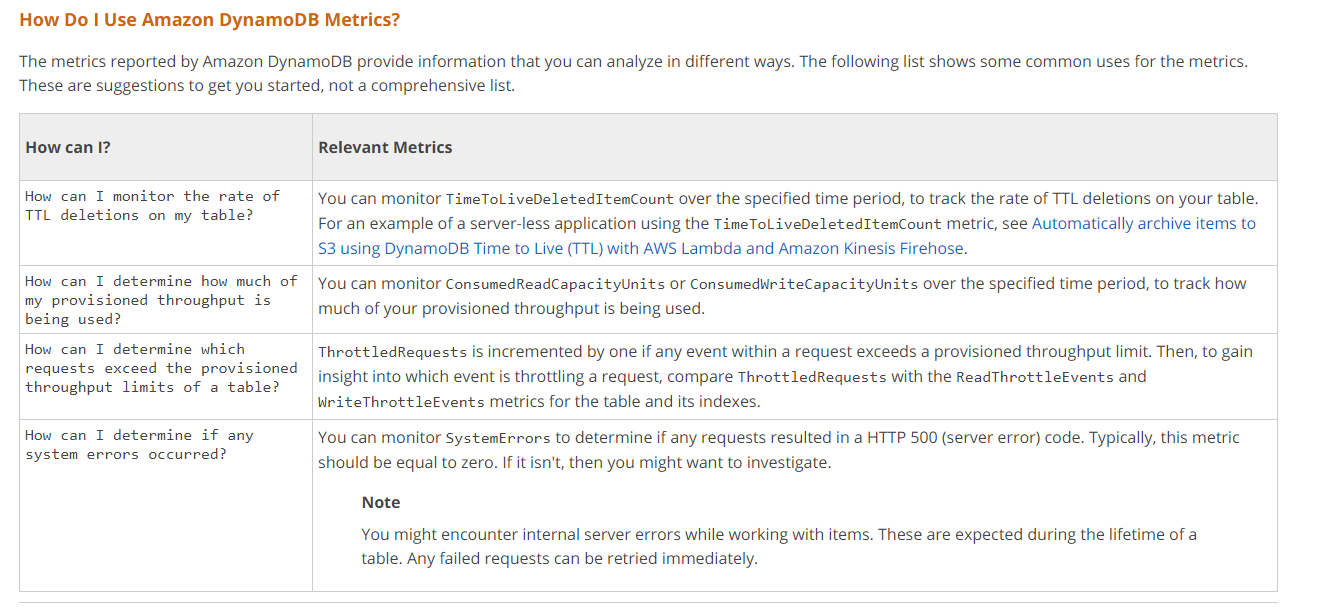
The below tables show the metrics available for DynamoDB.Option A is incorrect since the logs will not give the consumption of the Read and Write Capacity.
Option C is incorrect since cloudtrail is only used for API monitoring.
Option D is incorrect since this is only used for configuration management.
For more information on monitoring with Cloudwatch, please refer to the below URL-
https://docs.aws.amazon.com/amazondynamodb/latest/developerguide/monitoring-cloudwatch.html
The best approach to accomplish monitoring of DynamoDB tables is by using Cloudwatch metrics.
Option A, using Cloudwatch logs, is not the most appropriate solution because logs provide information on events and messages recorded during table activity, but not on table usage metrics.
Option C, using Cloudtrail logs, is also not an optimal solution because Cloudtrail logs track API calls made to the DynamoDB table, but they do not provide data on table utilization metrics.
Option D, using AWS Config logs, is also not the best approach because AWS Config logs track changes to resources in your AWS account, but not the utilization of DynamoDB tables.
Cloudwatch metrics are the recommended approach for monitoring DynamoDB tables. Cloudwatch metrics provide detailed data on how much Read and Write Capacity is being utilized, as well as other metrics such as the number of throttled requests and successful requests. With Cloudwatch metrics, you can set up alarms to alert you when utilization exceeds a certain threshold or when other conditions are met. This helps to identify potential issues and take action to prevent service disruptions or performance degradation.
To set up Cloudwatch metrics for your DynamoDB tables, you need to enable the DynamoDB Enhanced Monitoring feature. This feature captures detailed data on table utilization, including Read and Write Capacity, throttled requests, and more. You can then view this data in the Cloudwatch Metrics console or use the Cloudwatch API to retrieve and analyze the data programmatically. Additionally, you can use AWS CLI or SDKs to retrieve these metrics and monitor them on a regular basis.